3. Sensors and Channels: SVG Maps
[ Prev ] [ Index ] [ Next ]
JavaScript Functions
There are three JavaScript functions that are built ino the SVG maps:
-
writeText(txt)
This is the function set to the "onmouseover" attribute of sensors on the map. When the user points the mouse at a sensor, this function will write the corresponding channel name to a text box in the search section of the page.
writeDefault()
This function is set to the "onmouseout" attribute of sensors on the map. It clears the text box mentioned above once the mouse stops pointing at a sensor.
lookupChannel(id)
This function is set to the "onmousedown" attribute of sensors on the map. When the user clicks a sensor, this function sends the channel name for the sensor to the function map_to_channel(selection) located in script.js, which sends the channel name to the PHP form that looks up the channel in the database.
Adding Sensors to Map
To add interactivity to a sensor on the map in Inkscape:
1. Make sure that all the elements of the sensor that you want to change color are paths. For example, seismometers have a component that is a rectangle object in inkscape. To convert this to a path, select the object then on the menu bar go to Path > Object to Path.
2. Make sure the visual components are all in a group in Inkscape. Be careful not to group the components more than once, i.e. place a group into a group, since this will throw off the ability to highlight the sensor.
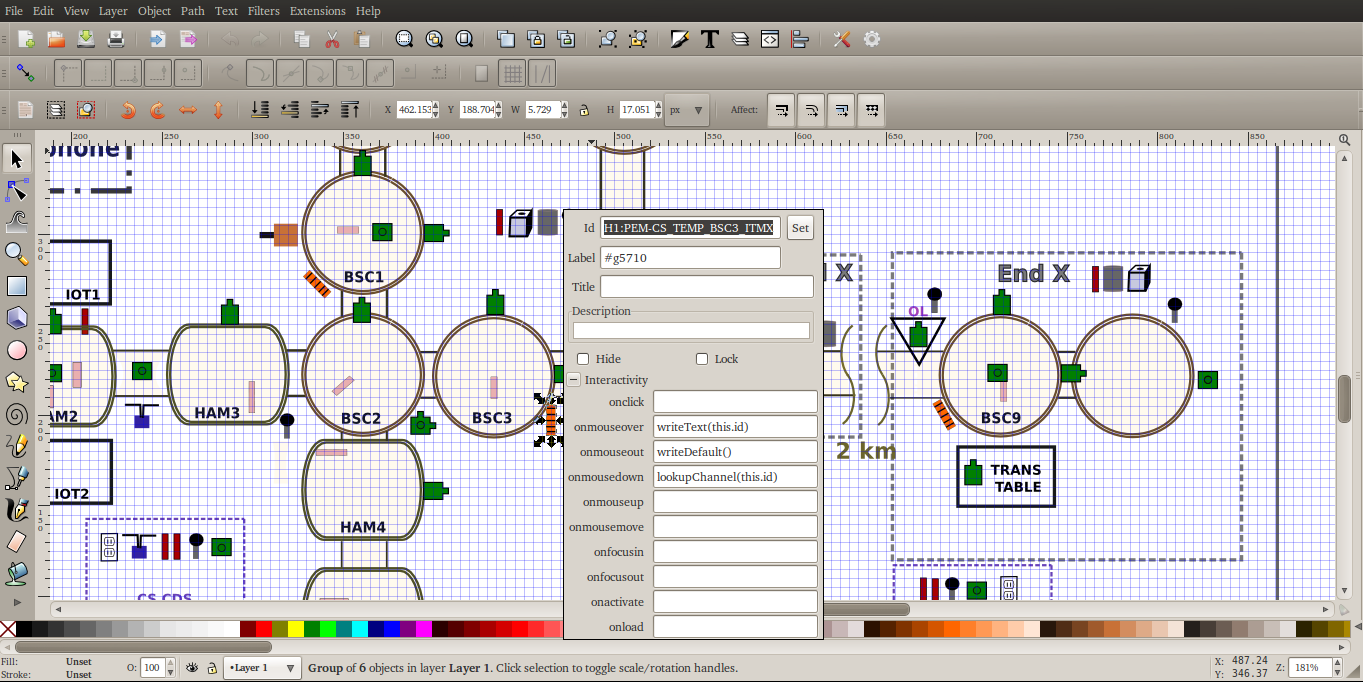
3. Once the sensor is properly grouped, select the sensor and on the menu bar go to Object > Object Properties. This will bring up a menu for all the attributes of your sensor group.
4. Set the "Id" of the sensor to the channel name corresponding to the sensor.
5. Open the "Interactivity" section of the menu. Set "onmouseover" to writeText(this.id), "onmouseout" to writeDefault(), "onmousedown" to lookupChannel(this.id). An faster way to do this, especially when adding interactivity to multiple sensors, is to open the .svg file in a text editor. Find the group tag corresponding to your sensor by searching for the channel name. Then, you can paste in three lines to the end of the group tag. For example, a group tag with full interactivity will look like:
	<g
		   id="H1:PEM-CS_TEMP_BSC3_ITMX"
		   transform="matrix(0.55252063,0,0,0.59289668,453.12844,201.55477)"
		   inkscape:label="#g5710"
		   onmouseover="writeText(this.id)"
		   onmouseout="writeDefault()"
		   onmousedown="lookupChannel(this.id)">